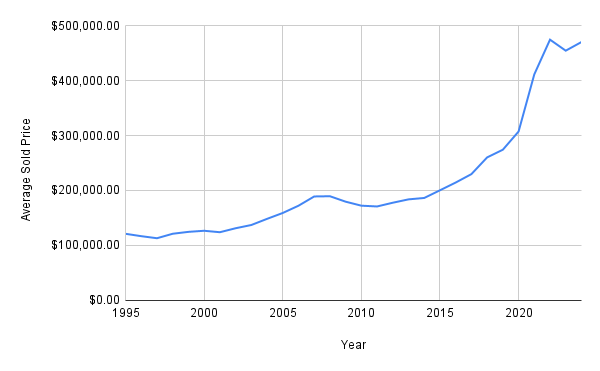
The average return on real estate in Cache County Utah is: 5.04%.
The highest gain was in 33.89% in 2021.
The lowest loss was -5.24% in 2009.

Here is the data*:
| Year | Ave Sold Price | Percent Change |
| 1995 | $121,227 | |
| 1996 | $116,895 | -3.57% |
| 1997 | $113,167 | -3.19% |
| 1998 | $121,314 | 7.2% |
| 1999 | $124,760 | 2.84% |
| 2000 | $126,742 | 1.59% |
| 2001 | $124,098 | -2.09% |
| 2002 | $131,323 | 5.82% |
| 2003 | $137,216 | 4.49% |
| 2004 | $148,388 | 8.14% |
| 2005 | $159,099 | 7.22% |
| 2006 | $172,289 | 8.29% |
| 2007 | $189,129 | 9.77% |
| 2008 | $189,561 | 0.23% |
| 2009 | $179,637 | -5.24% |
| 2010 | $172,369 | -4.05% |
| 2011 | $170,948 | -0.82% |
| 2012 | $177,751 | 3.98% |
| 2013 | $183,855 | 3.43% |
| 2014 | $186,400 | 1.38% |
| 2015 | $200,376 | 7.5% |
| 2016 | $214,453 | 7.03% |
| 2017 | $229,781 | 7.15% |
| 2018 | $260169 | 13.22% |
| 2019 | $174,172 | 5.38% |
| 2020 | $307,228 | 12.06% |
| 2021 | $411,172 | 33.83% |
| 2022 | $474,341 | 15.36% |
| 2023 | $454,292 | -4.23% |
| 2024 | $469,999 | 3.46% |
| Average Percent Increase | 5.04% |
* All data is from www.utahrealestate.com